Analytics Filters
You can filter and segment all charts and statistics using the filters at the top of the page:- Timeframe: Choose preset intervals (e.g. Last 7 Days, Last 30 Days) or select a custom date range.
- Product: Filter metrics for a specific product or plan tier.
- Product Type: Filter by product billing categories (e.g. one-time purchases, subscriptions).
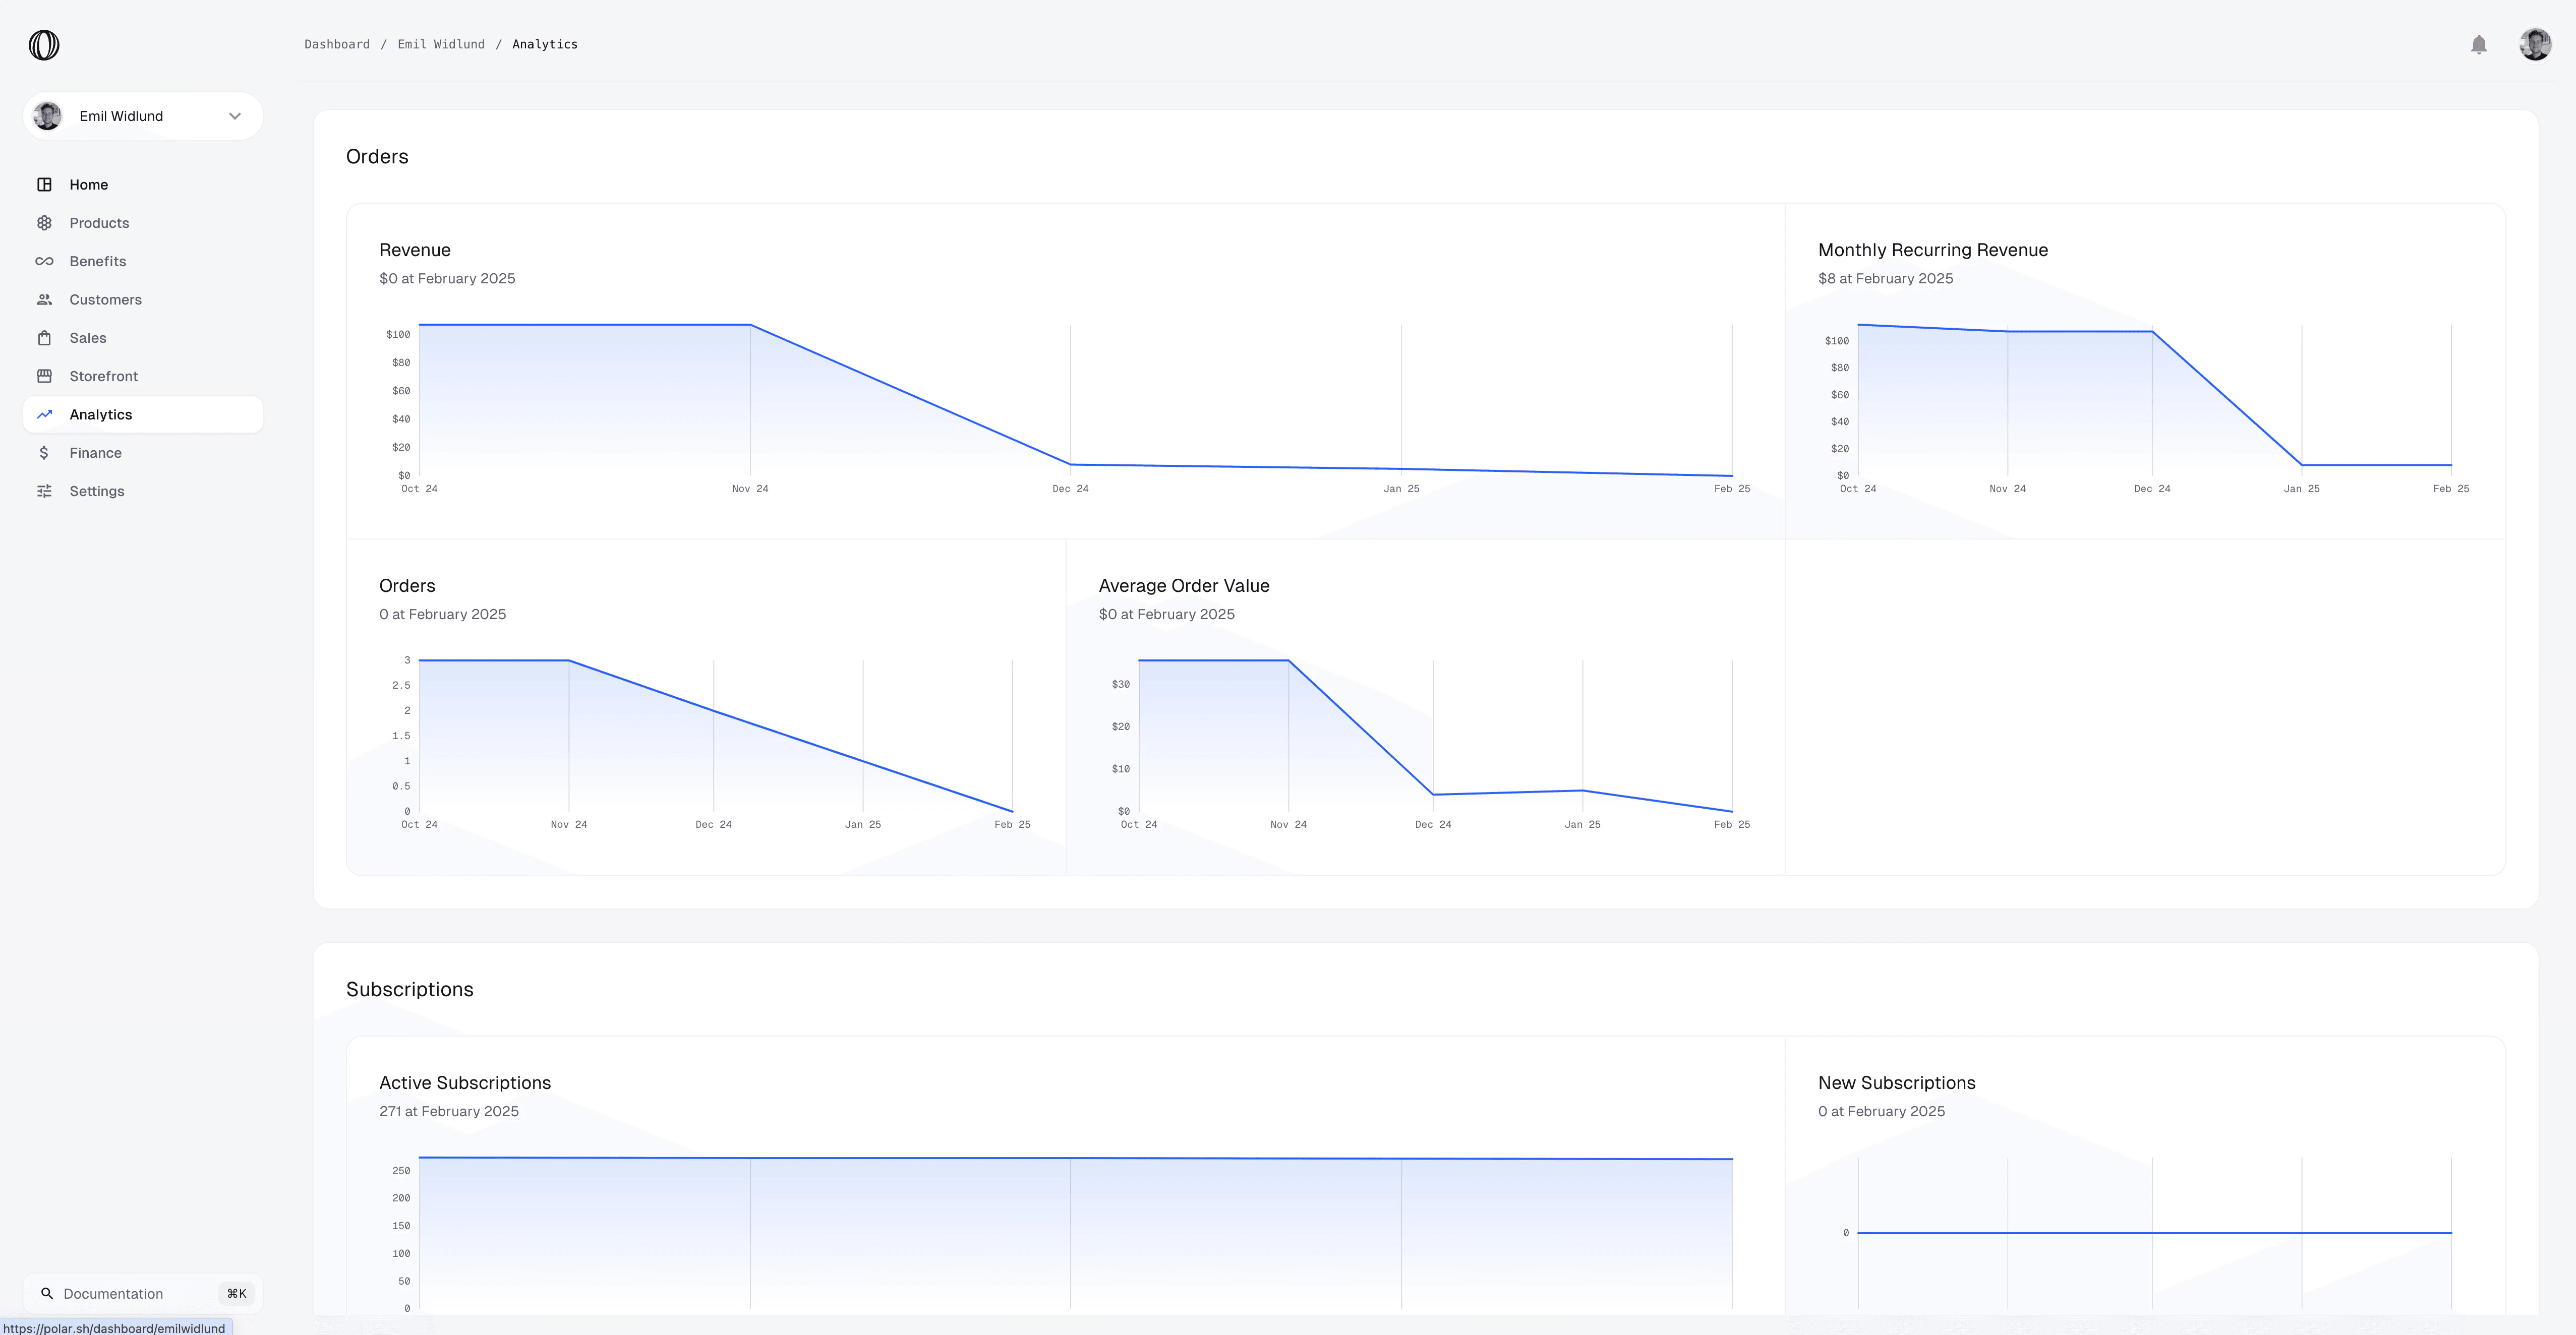
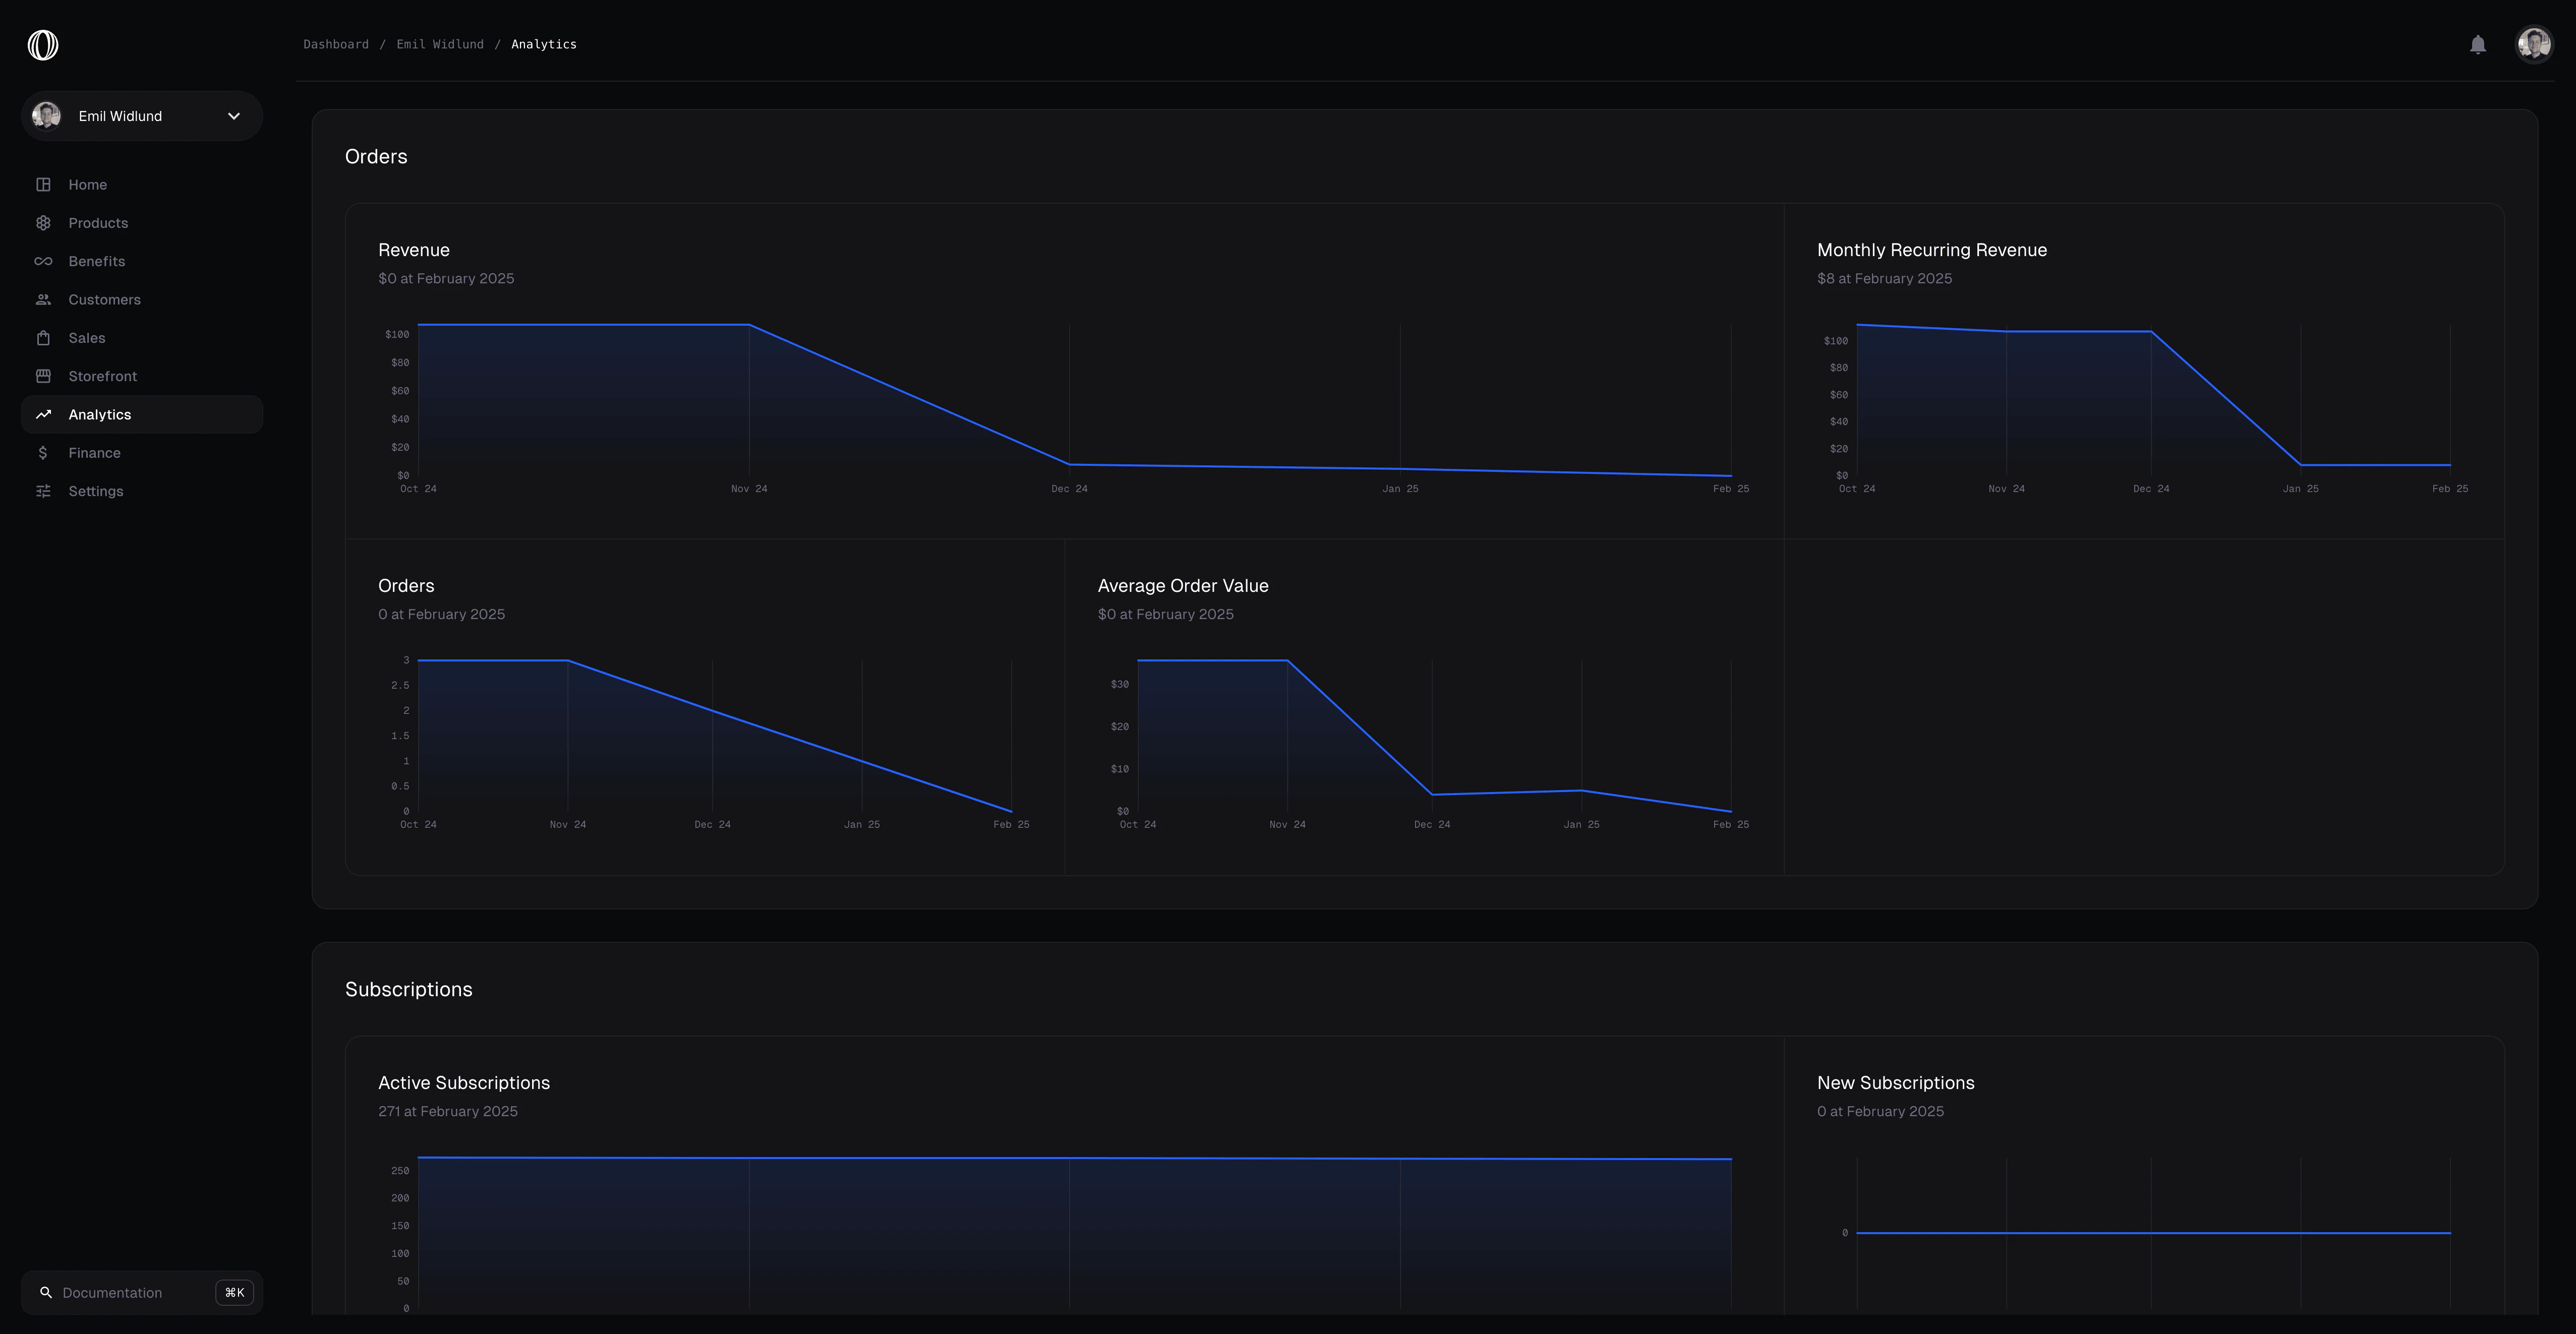
Core Sales Metrics
- Net Volume: Total earnings from sales, excluding refunded amounts and processing fees.
- Gross Revenue: The total amount captured from customers before fees are deducted.
- Fee Breakdown: Visual representation of the platform application fees (3.0% + 15¢) and payment processor fees.
- Checkout Success Rate: The percentage of successfully completed checkout sessions versus failed or abandoned checkout attempts.
Customer & Subscription Analytics
- Active Customers: The total count of unique active customers currently in your workspace.
- Customer Retention: Cohort analysis tracking how many subscribers renew month-over-month.
- Top Countries: Geographical breakdown mapping where your sales originate based on client checkout IP addresses.